Close Menu
  • Home
  • Stock
  • Parenting
  • Personal
  • Fashion & Beauty
  • Finance & Business
  • Marketing
  • Health & Fitness
  • Tech & Gadgets
  • Travel & Adventure

Subscribe to Updates

Subscribe to our newsletter and never miss our latest news

Subscribe my Newsletter for New Posts & tips Let's stay updated!

What's Hot

iPhone 16 Now Available in India For As Low As Rs. 69,500; Offer Valid for Limited Period

mayo 17, 2025

Oppo A5 5G, Oppo A5, Oppo A5x Listed Online; Colour Options, Specifications Revealed

mayo 17, 2025

Google One Hits 150 Million Subscribers With Help of AI

mayo 17, 2025
Facebook X (Twitter) Instagram
  • Home
  • Contact us
  • DMCA
  • Política de Privacidad
  • Publicidad en DD Noticias
  • Sobre Nosotros
  • Términos y Condiciones
Facebook X (Twitter) Instagram
DD Noticias: Tu fuente de inspiración diariaDD Noticias: Tu fuente de inspiración diaria
  • Home
  • Stock
  • Parenting
  • Personal
  • Fashion & Beauty
  • Finance & Business
  • Marketing
  • Health & Fitness
  • Tech & Gadgets
  • Travel & Adventure
DD Noticias: Tu fuente de inspiración diariaDD Noticias: Tu fuente de inspiración diaria
Home » Meta Is The Only Magnificent 7 Stock In The Green In 2025—Watch These Key Levels
Personal Development

Meta Is The Only Magnificent 7 Stock In The Green In 2025—Watch These Key Levels

Jane AustenBy Jane Austenmarzo 15, 2025No hay comentarios3 Mins Read
Facebook Twitter Pinterest LinkedIn Tumblr Email
Share
Facebook Twitter LinkedIn Pinterest Email


Source: TradingView.com

Meta Platforms shares jumped on Friday amid a broader market rally, after logging their biggest one-day drop since July the previous session.

Meta is the only member of the Magnificent Seven group of mega-cap technology stocks to be in positive territory so far this year.

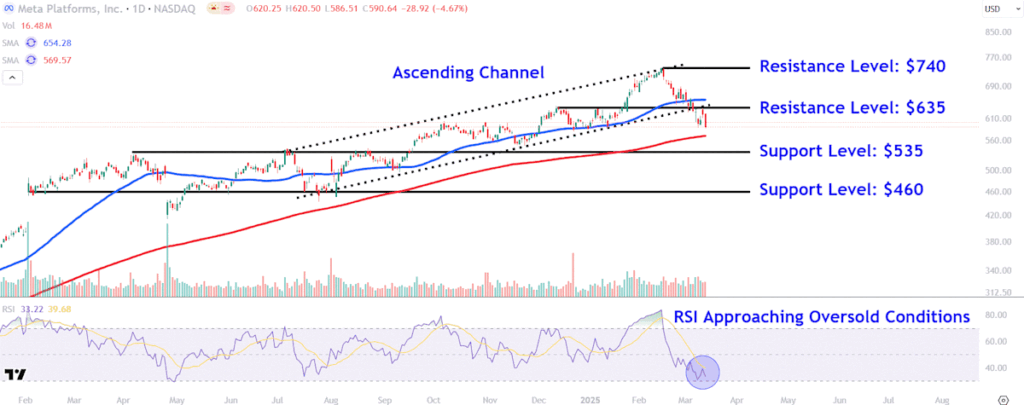
Investors should watch major support levels on Meta’s chart around $535 and $460, while also monitoring crucial resistance levels near $635 and $740.

Meta Platforms (META) shares jumped on Friday amid a broader market rally, after logging their biggest one-day drop since July the previous session.

The social media giant’s stock has come under pressure over the past month as the broader market has tumbled, with Big Tech stocks suffering outsize losses amid concerns about lofty valuations and slowing growth. Meta shares are down 18% from their record high set in mid-February.

However, Meta is the only member of the Magnificent Seven group of mega-cap technology stocks that remains in positive territory for 2025. The stock is up nearly 4% since the start of the year, while each of the other Mag 7 stocks is down at least 8%.

Below, we break down the technicals on Meta’s chart and identify major price levels worth watching out for amid the possibility for further price swings.

Meta shares staged a decisive breakdown below an ascending channel on Monday before the price retested the pattern’s lower trendline in Wednesday’s trading session. Bears used the bounce as an opportunity to accelerate selling yesterday, before today’s recovery.

Meanwhile, the relative strength index (RSI) confirms weak price momentum with a reading near its August lows, though looming oversold conditions may trigger short-term recovery rallies in the stock.

Let’s use technical analysis to locate major support and resistance levels that investors may be monitoring.

Meta shares rose 3% on Friday to close at $607.60, after falling nearly 5% yesterday.

The first overhead level to monitor is $635, an area that provides a confluence of resistance from the ascending channel’s lower trendline that sits alongside peaks which formed on the chart in December and January.

A convincing close above this level may see bulls make another run at the $740 level, a location on the chart where Meta shares would likely attract significant attention near their all-time high (ATH).

The first support level to watch sits around $535. The shares could find buying interest in this area near a multi-month trendline that connects three prominent peaks on the chart between April and August last year.

Story Continues

Selling below this important technical level could see the stock revisit lower support at the $460 level. Investors who favor buy-and-hold strategies may look for entry points in this region near the low of a consolidation period that followed last year’s February breakaway gap, a location that also roughly aligns with the July and August troughs.

The comments, opinions, and analyses expressed on Investopedia are for informational purposes only. Read our warranty and liability disclaimer for more info.

As of the date this article was written, the author does not own any of the above securities.

Read the original article on Investopedia


Source link

Share. Facebook Twitter Pinterest LinkedIn Tumblr Email
Jane Austen
  • Website

Related Posts

Buy, Sell, or Hold Post Q4 Earnings?

marzo 17, 2025

Buy, Sell, or Hold Post Q4 Earnings?

marzo 17, 2025

Buy, Sell, or Hold Post Q4 Earnings?

marzo 17, 2025
Add A Comment
Leave A Reply Cancel Reply

Editors Picks

Fast fashion pioneer Forever 21 files for bankruptcy — again

marzo 18, 2025

Dow gains 350 points as stocks climb for 2nd day after S&P 500 enters correction

marzo 18, 2025

Yellow Creditors Have Own Plan to Share Trucker’s $550 Million

marzo 18, 2025

Alphabet in Talks to Buy Startup Wiz for $30 Billion, WSJ Says

marzo 18, 2025
Top Reviews
DD Noticias: Tu fuente de inspiración diaria
Facebook X (Twitter) Instagram Pinterest Vimeo YouTube
  • Home
  • Contact us
  • DMCA
  • Política de Privacidad
  • Publicidad en DD Noticias
  • Sobre Nosotros
  • Términos y Condiciones
© 2025 ddnoticias. Designed by ddnoticias.

Type above and press Enter to search. Press Esc to cancel.